2022
Industry
Real Estate
Company
Ziegert
Status
Conception
Team
Designer, Product Manager, Engineer Manager, Data Engineer

Context
Metatrust, a Ziegert Group startup, aims to bring transparency to German's B2B real estate market with a Saas data product, giving unique insights from a data set of 90.000 exposés.
Do you know why an apartment might cost € 560,000 instead of any other value? There is a job called "value analyst", whose main goal is to calculate how much a real estate property might cost. They can work assisting both sellers and buyers to find out the right price.
Value analysts utilize all available data to calculate prices. However, the German market lacks transparency compared to the UK or USA, making the job challenging, especially in the B2B Global sales market (selling an entire building or set of buildings). Most of these sales occur through emails or phone calls, where data capture is limited.
Metatrust, a startup from Ziegert Group had an interesting opportunity. Since Ziegert is a company that covers a big spectrum of the real estate market (development, valuation, marketing, sales), the company receives tons of exposés from B2B Global offers. We created a database with 90.000 exposés, providing unique insights about the market, and were considering building a SaaS data product to bring more transparency to this market.
Potential users
Metatrust's preliminary discovery identified two potential users: value analysts and building developers. Access to future data from exposés aids developers in strategic planning, pricing, and decision-making in real estate.
Before I joined Metatrust, the company had already made exploratory discovery to define potential users for this project. Beyond the value analysis, other professionals might take advantage of the data we have: building developers.
Building developer needs to predict how a certain area will evolve in the future, to figure out what will be future demand and what they should build. Having access to future data, from the exposés, they would have a clear understanding of what is being built on an area, and predict future demands needed for their strategic plans.
Professionals

Value analyst

Developers
A developer will basically work on a real estate developer firm, but a value analyst may work on a sort of different companies, these might be: real estate agencies, investment companies (investment funds, insurance, banks), consultancy companies (usually involved in big B2B global transactions).
4 company groups:
Developers

Brokers

Investment companies

Consultancy companies
In a very simplified view, all those professionals have common jobs to be done:
Define an optimal price for a global sale.
Helping buying, selling, or developing decisions.
Leverage trends in a particular area.
Understanding what to buy, sell, or develop.
Problem

How might we use future data (from exposés) to improve the quality of decisions on Germany's real estate market?
Side goals
Allow value analysts to calculate global property's value more accurately.
Reduce uncertainty on real estate development strategies.
Success metrics
Internal users from Ziegert Group are using the product regularly.
Get 5 external users that would pay for the product.
Discovery
I initiated project discovery by analyzing past documentation, leveraging CAD Matrix for user research insights, benchmarking against competitors, and collaborating closely with the product manager.
When I started working at Metatrust the product team had already started defining the scope for the MVP for MetaMaps, a map-based data visualization tool to help value analysts and real estate developers. Everything was well-documented on our confluence, and I had support from the C-level to review, challenge, and create the vision for this product from 0 to 1.
Our 3 main inputs:

C.A.D Matrix

Benchmarking analysis

User research
The first thing I did was to read all the documentation and create a C.A.D Matrix (Certains, Assumptions, and Doubts), this helped me to systematically share my interpretation from documentation with the product manager and also spot risk assumptions on the initial plan that should be investigated on user research.
After that, I studied the current solutions in the market, so I could better understand this problem domain, and its current solutions, and think about where we could have an advantage. We reviewed the C.A.D Matrix and Benchmarking analysis with the product manager and identified important questions to address in user research.
User research
Interviewed Ziegert Group professionals to map data job roles for user segments, understanding workflows, and empathizing to design user-friendly flows, gathering insights on current practices.
The goal of this interview round was to map data-related jobs from our two user segments. We interviewed different professionals within the Ziegert Group to understand their work process. This was crucial to designing a user flow that fits the user's current workflow and uses patterns that are already known by our future users. More subjectively, it is also important to talk with the user to better empathize with them and their problems.
Key Insights

Identified user data jobs and expected outcomes.

Understood how data-driven decisions are currently done.

Maped user's workflow.
Ideation

How might we use future data (from exposés) to improve the quality of decisions on Germany's real estate market?
Idea
Create a map-based data visualization SaaS product with future data about Berlin's real estate market. Since Ziegert group works mostly in Berlin, we have a higher concentration of data points about the city, and it is also a way to reduce the scope for the MVP. There are many other types of data we could use, but we already have other products on the market providing it. Future data is what could set us apart, therefore is our focus on the MVP.
Key assumption
Future data can give a significant advantage for value analysts and real estate developers, by providing unique insights on the market, which will allow them to do better valuations and create more effective strategies.
Solution
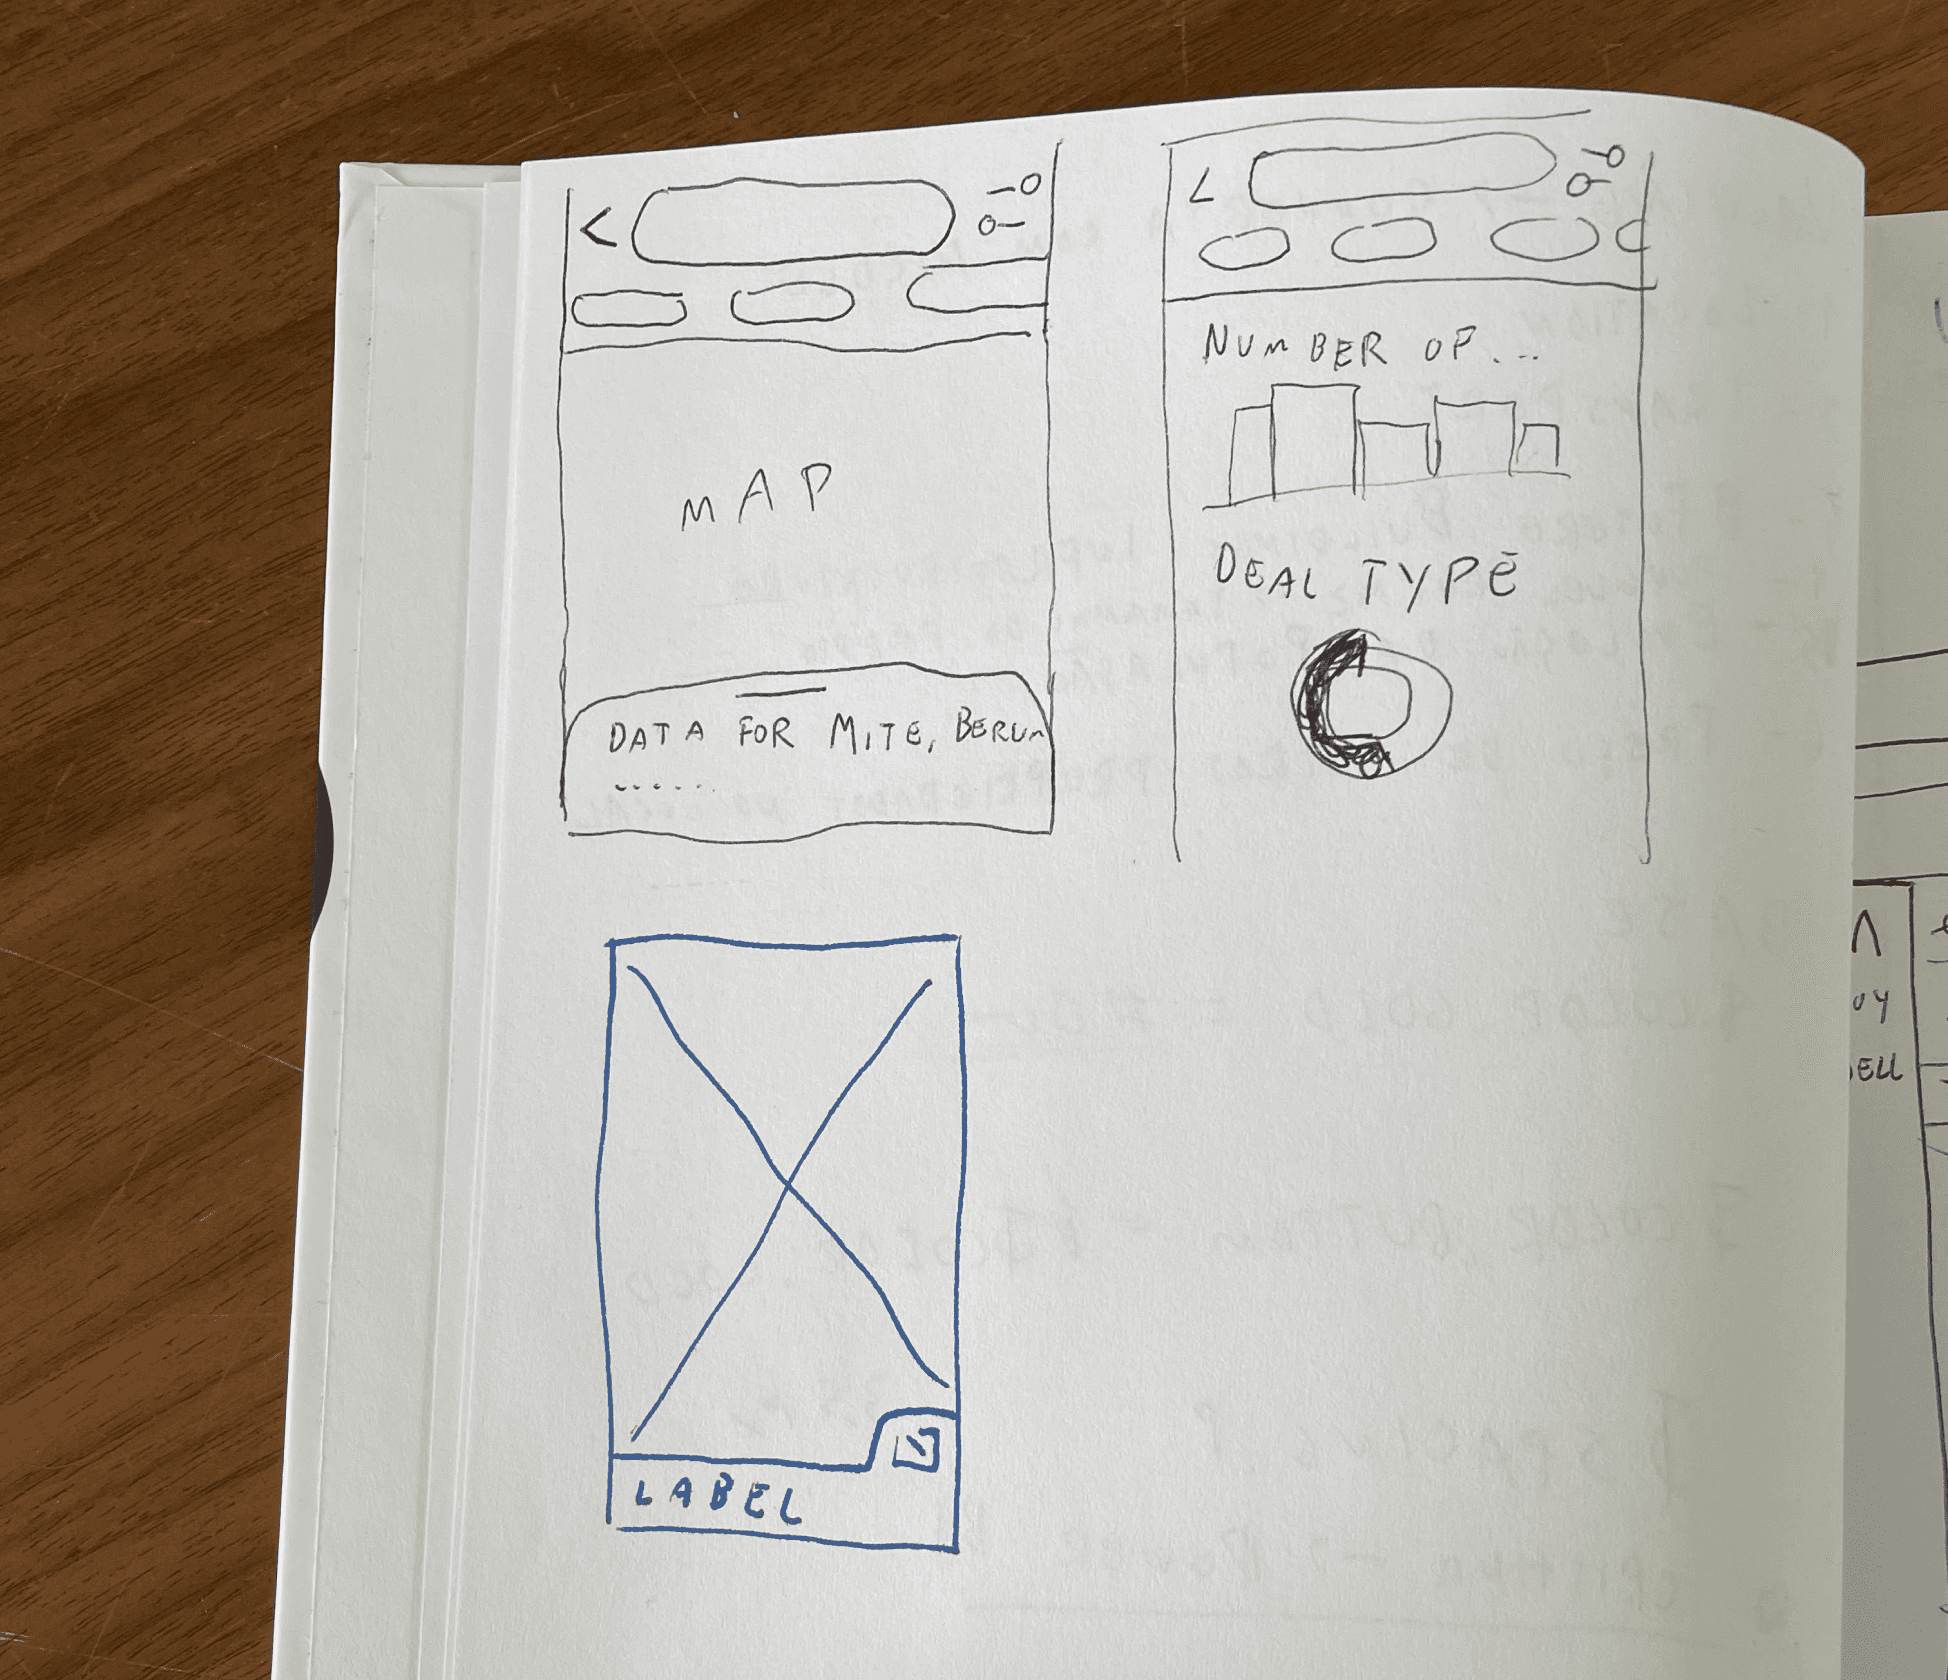
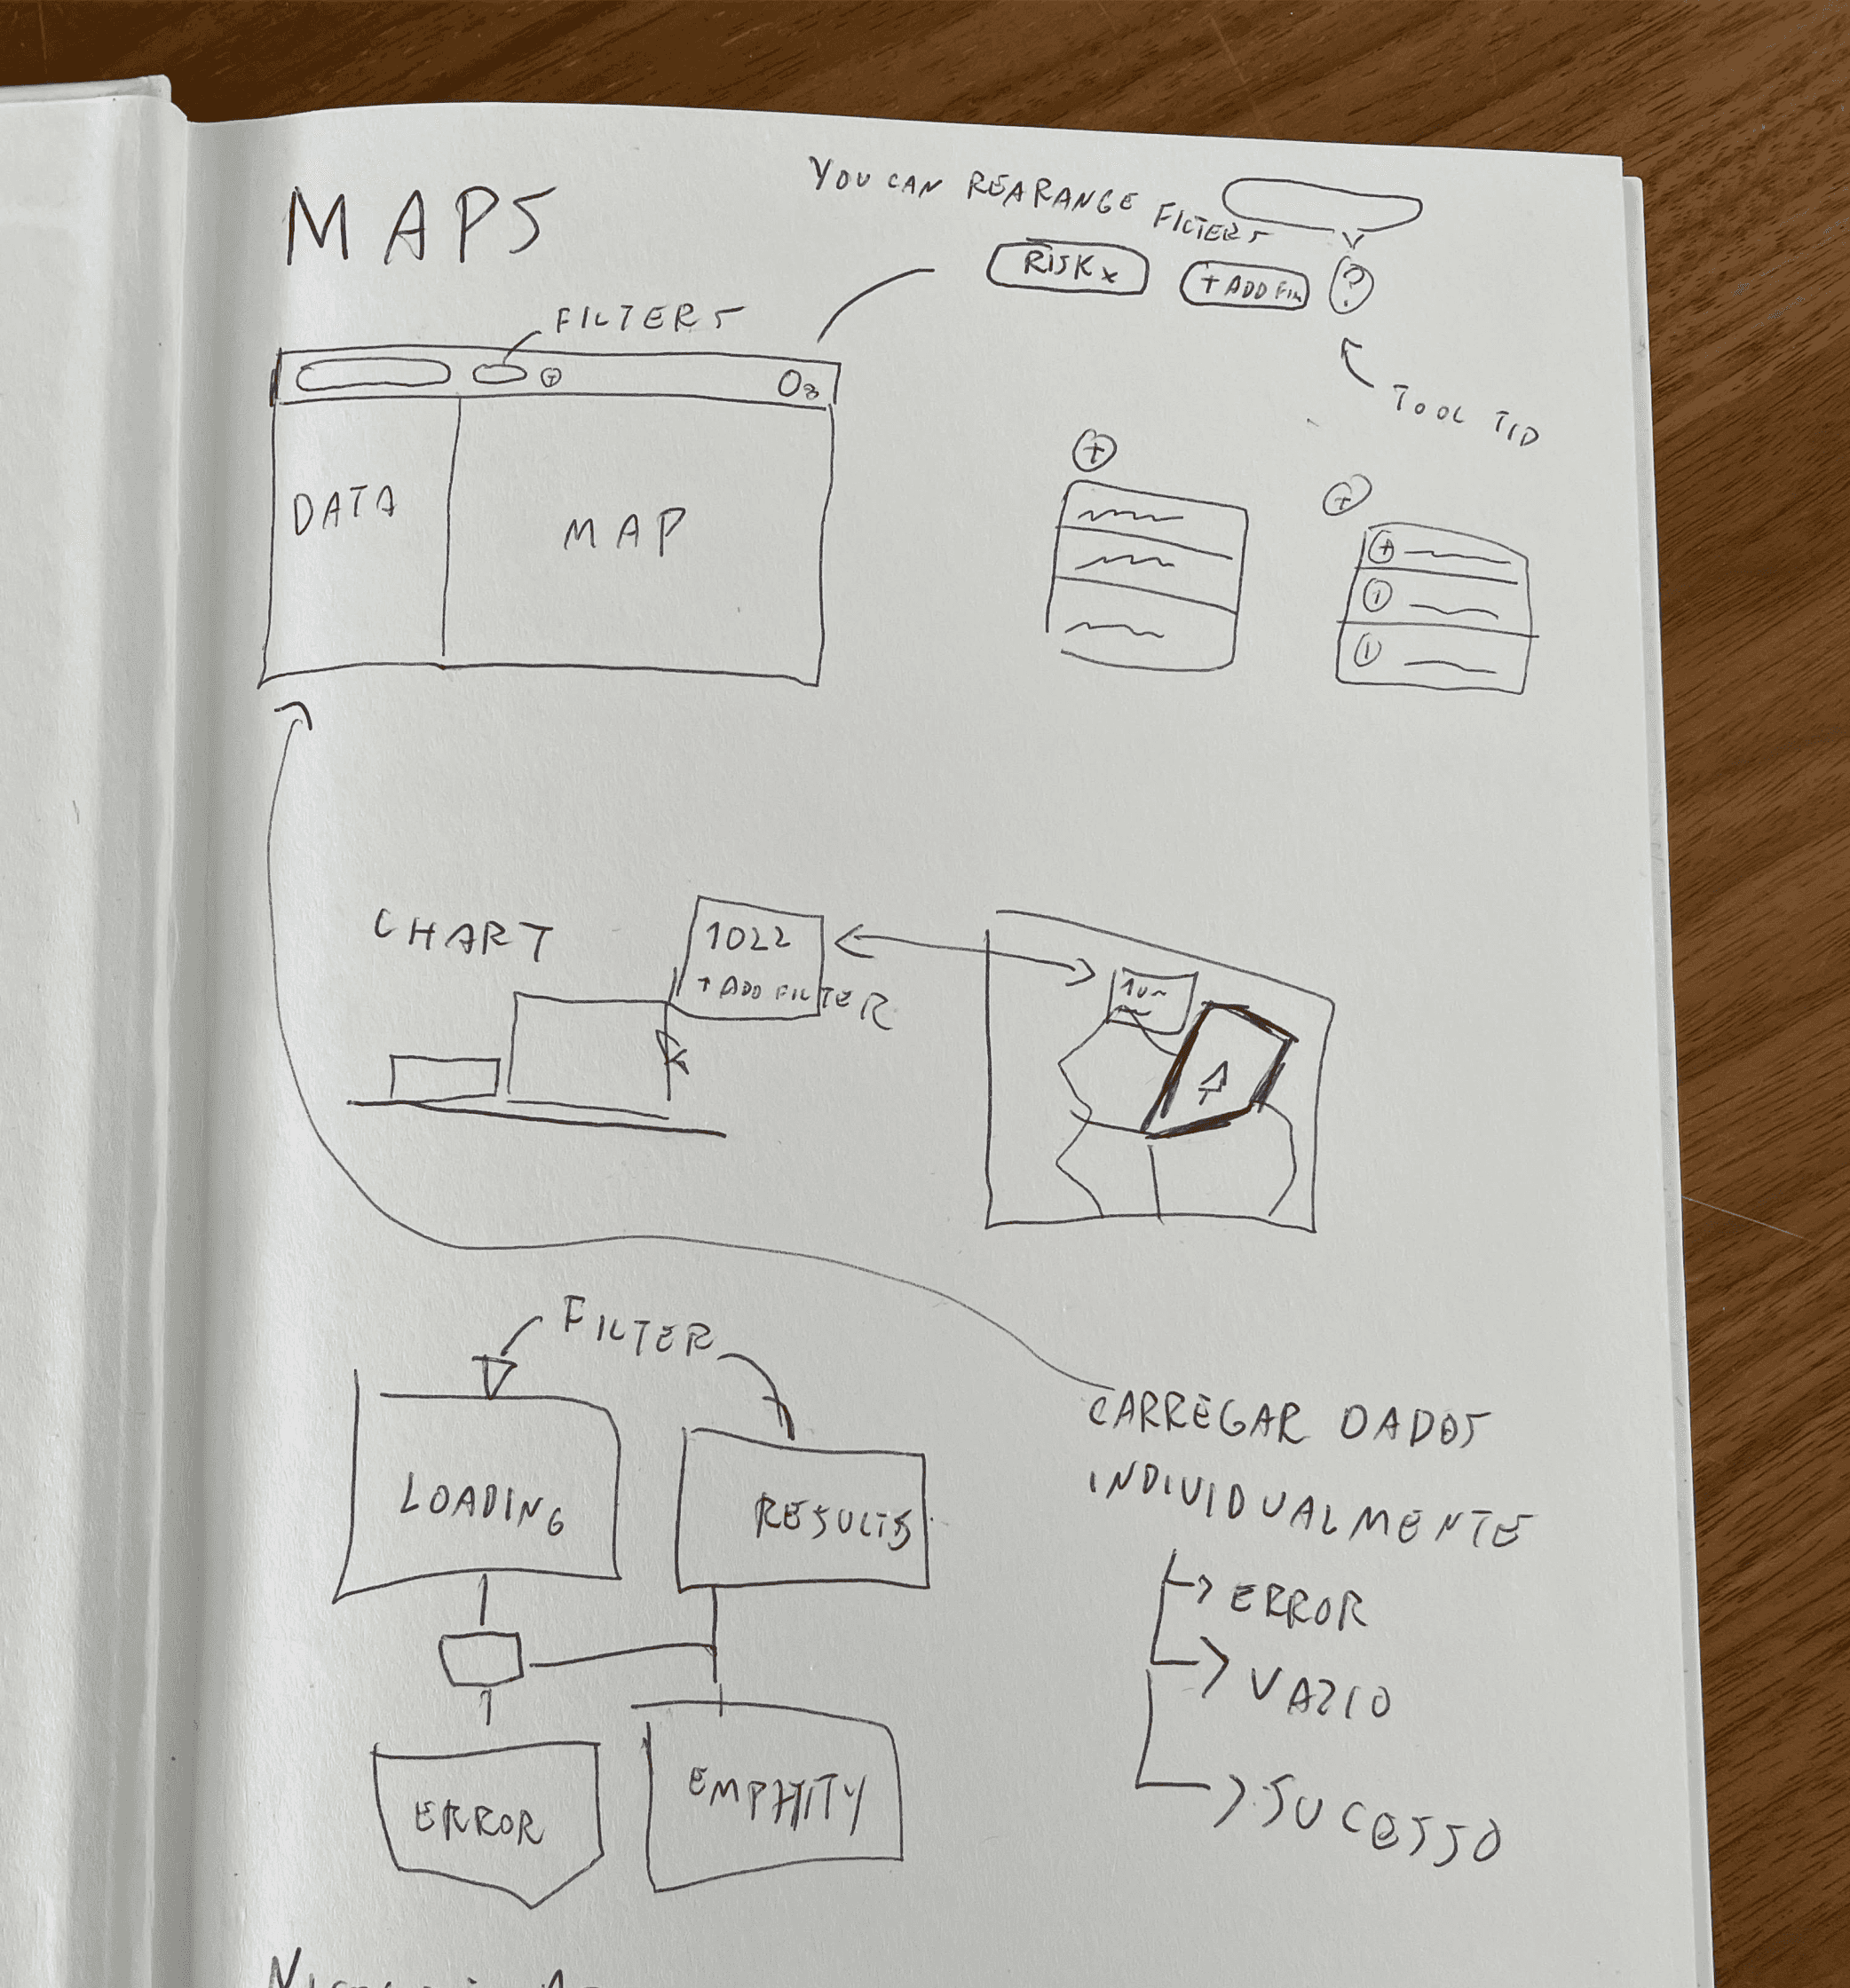
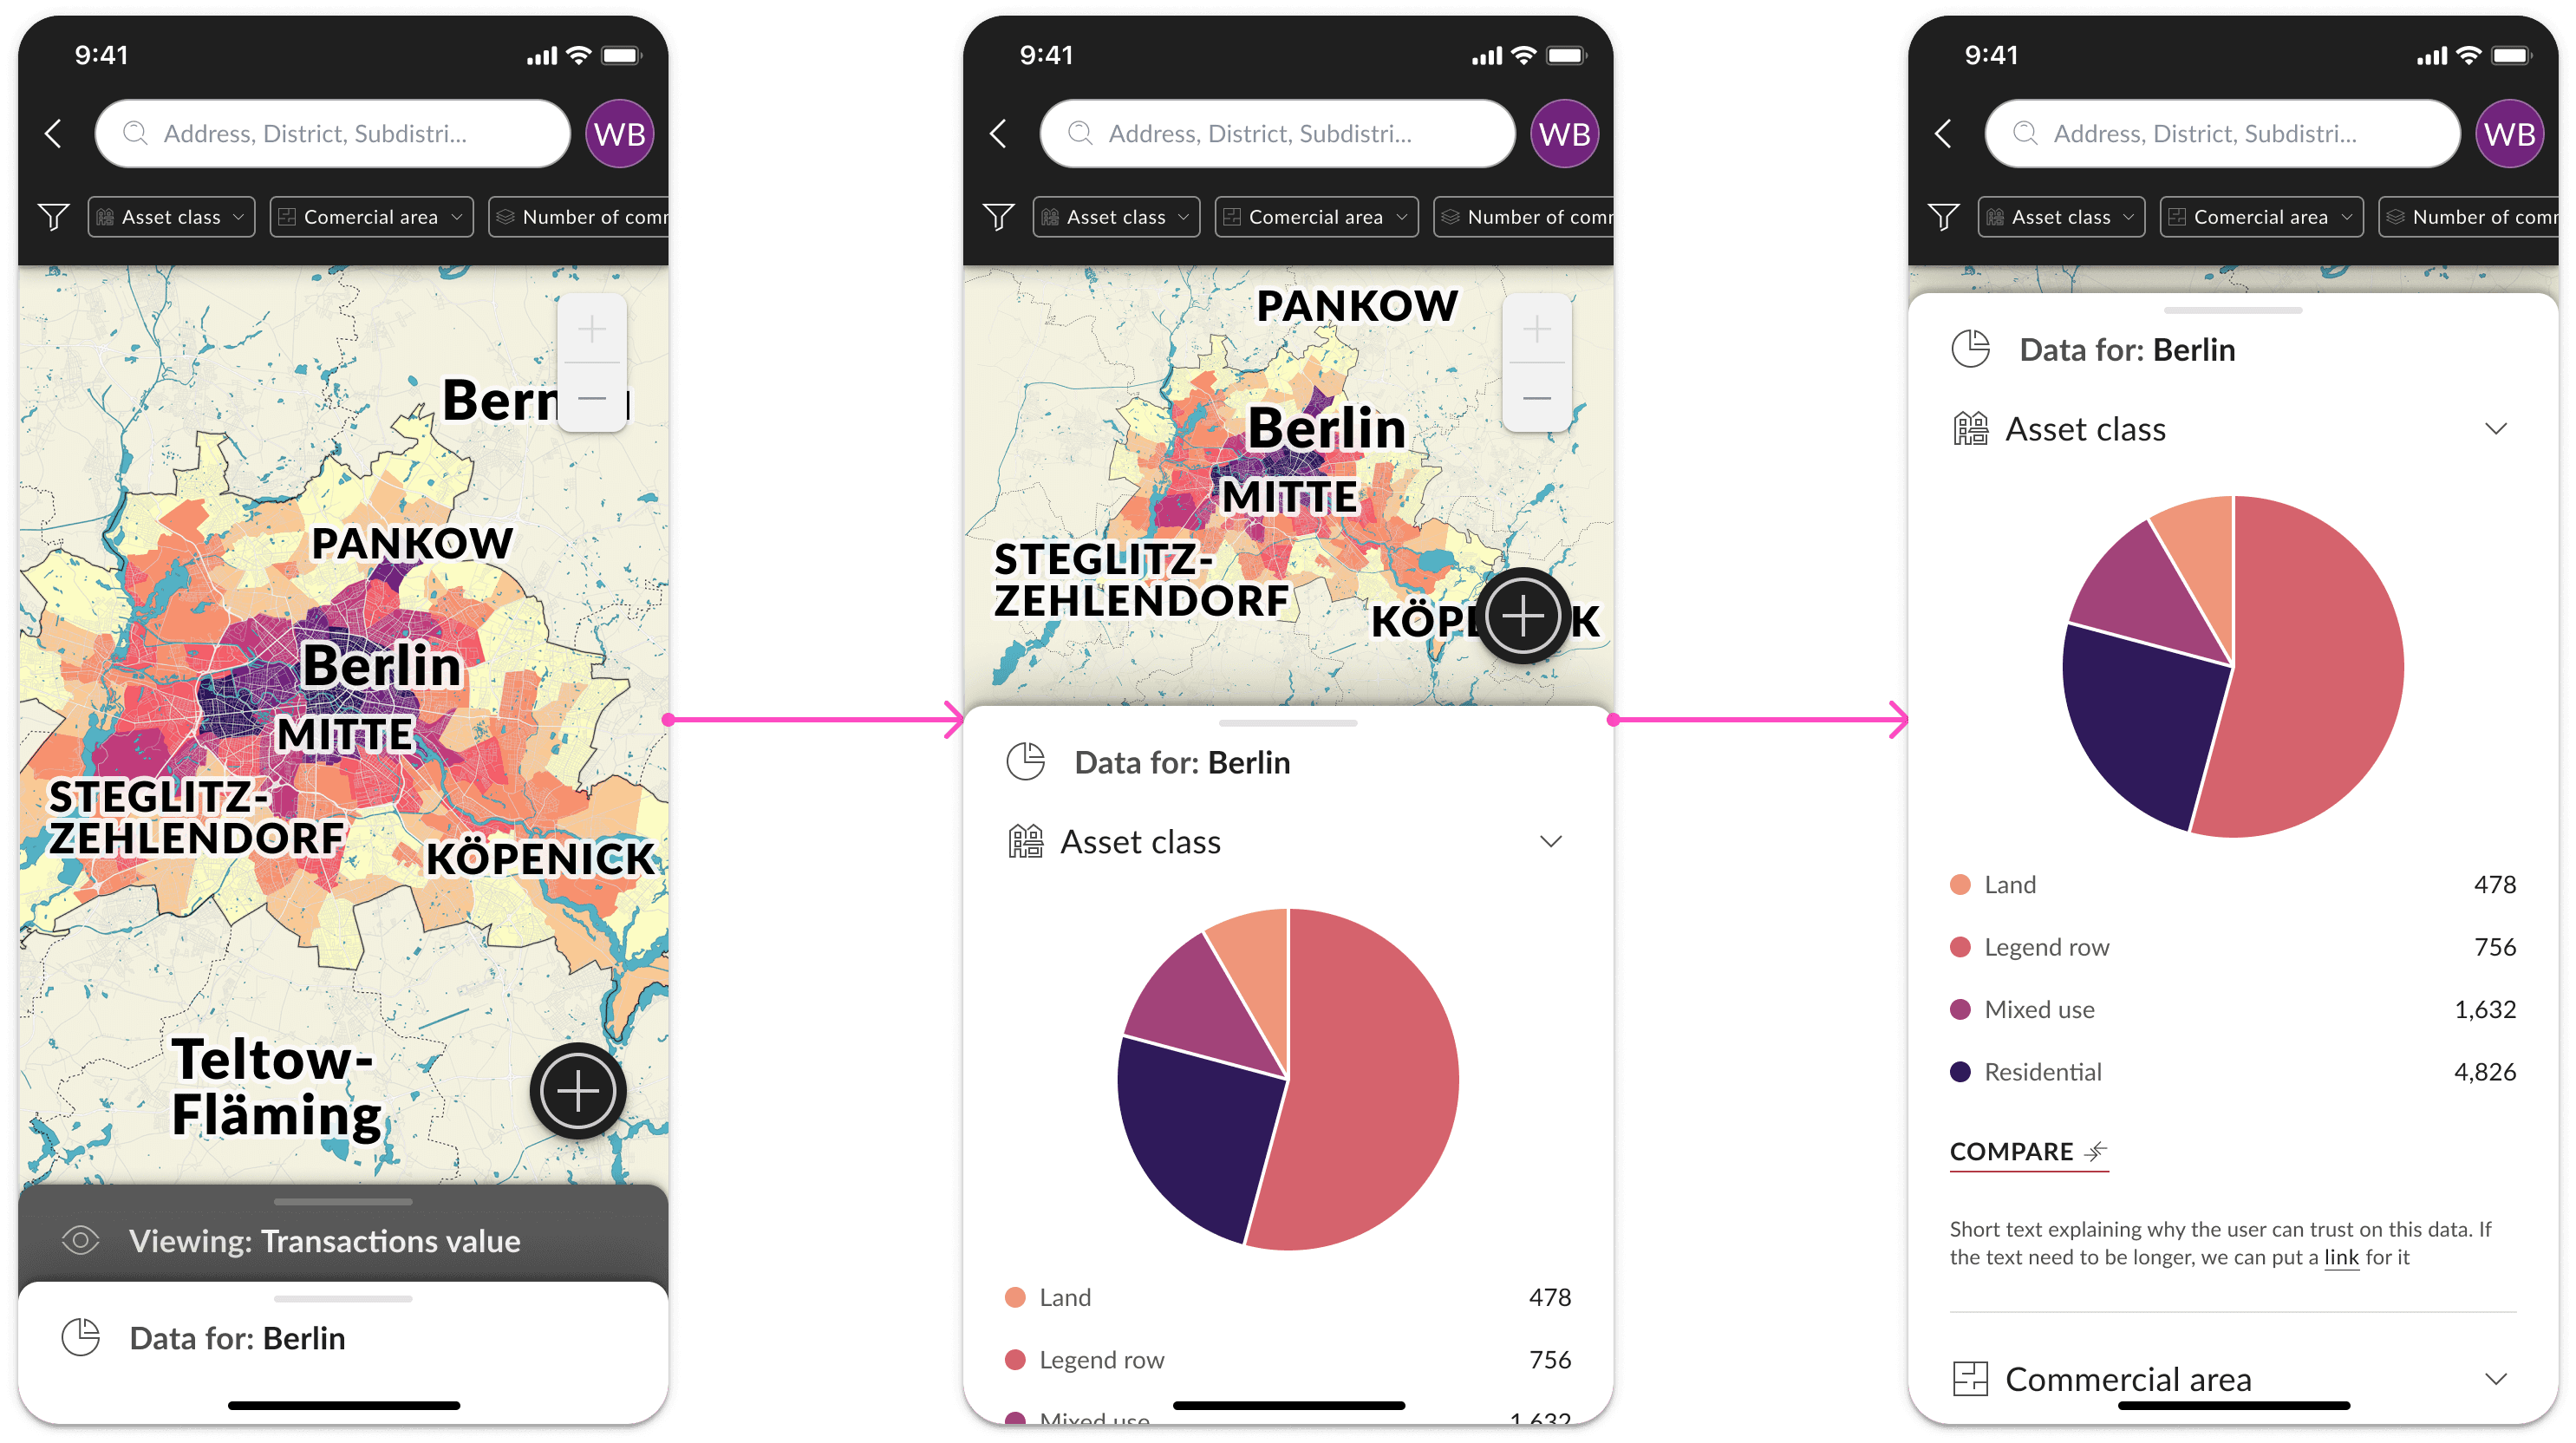
It is not just about showing data but allowing the user to manipulate it to get the information they need to do their job. To do so, I designed different flows:
Switching between map and charts view (only needed on mobile).
Searching and selecting a district to focus on.
When searching an address, focus on a radius and allow the user to change the radius size.
Filtering data.
Compare data from multiple regions.
Changing what data is being displayed on the map.
Below you can find a simplified version of those flows.
Color
Considering colorblindness prevalence, explored alternative heatmap colors beyond red-green scale to ensure inclusivity for German market, leveraging Hue and Brightness contrast and Color Blind Figma Plugin simulations for accessibility.
When you think about heatmap, the first colors that come to mind are green and red. There are thousands of maps using a red-to-green scale. This scale is also popular on data products in general. However, there is a problem: Red-green deficiency is the most widespread type of color blindness, accounting for about 50 percent of all cases. European males have also a higher probability of having this condition. Since this product would focus on the German market, we could not create a product that excludes 3.5 million Germans.
I explored different possibilities that would work for all types of color blindness. To do so, we need to consider contrast in terms of Hue and Brightness to create the scale. I also used Color Blind Figma Plugin to simulate how people with different types of colorblindness would see the map.
Typical color vision
Tritanomaly vision
Deuteranopia vision
Deuteranomaly vision
Protanopia vision
Protanomaly vision
Tritanopia vision
Achromatomaly vision
Achromatopsia vision
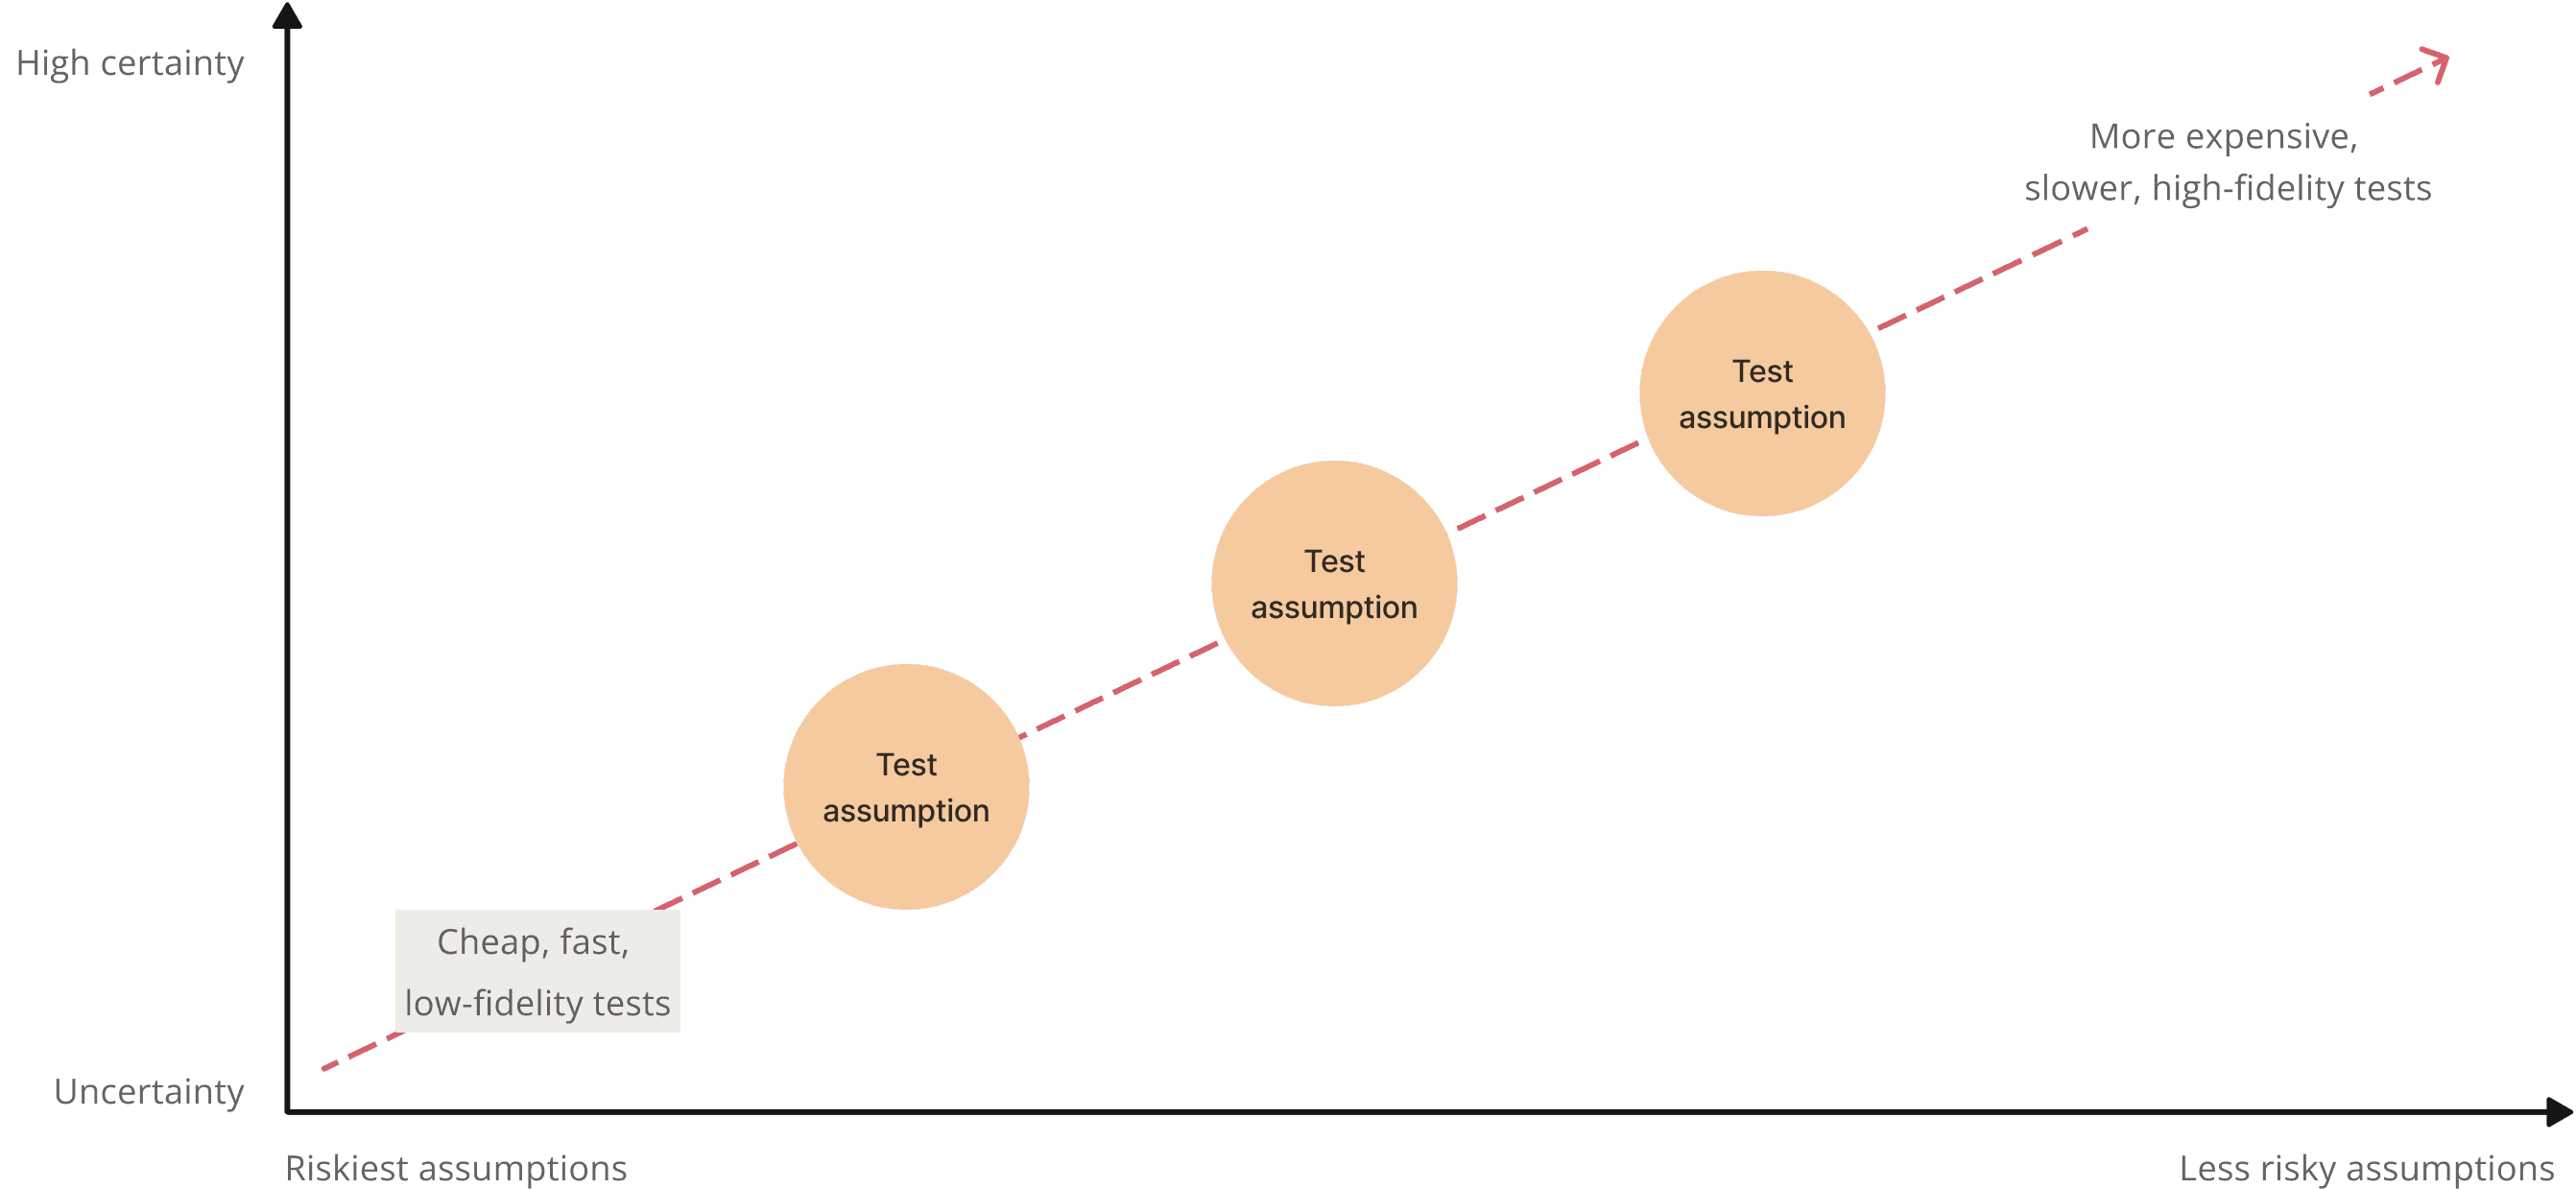
Testing
Testing a B2B data product involved real data in the work environment over weeks, examining its impact on user tasks. Using Power BI prototype with 90,000 exposés, followed by weekly feedback meetings for iterative enhancements.
How would you test a B2B data product, which brings a new type of data to the market?
Our team discussed this and we came to this conclusion:
We need to test with real data.
We need to test in the real work environment.
We need to test over a couple weeks.
We need to test if this new data influences the user's jobs.
To do so we used the data from the 90.000 exposés, that we had available, to create a prototype in Power BI. We gave this prototype to potential users and we had weekly feedback meetings with them, to check how they were using the product, and get feedback on things we could improve in the prototype. Our goal was to continually improve the prototype, and invest more resources when we saw that the risk was tolerable.
Results

The experiment showed us that, despite users having an interest in the solution, it was not a game-change product, which would drastically improve the outcome of their job. In a market in crisis, we decided to not invest in this product.
4 weeks
Of testing with weekly feedback meetings
800,000 EUR
Saved by not building the product
Lean test
With a small team, and not much effort we were able to test the idea before compromising much recourses.

